Principles of Confocal Laser Scanning Microscopy
Confocal Laser Scanning Microscopy (CLSM) is a special kind of light
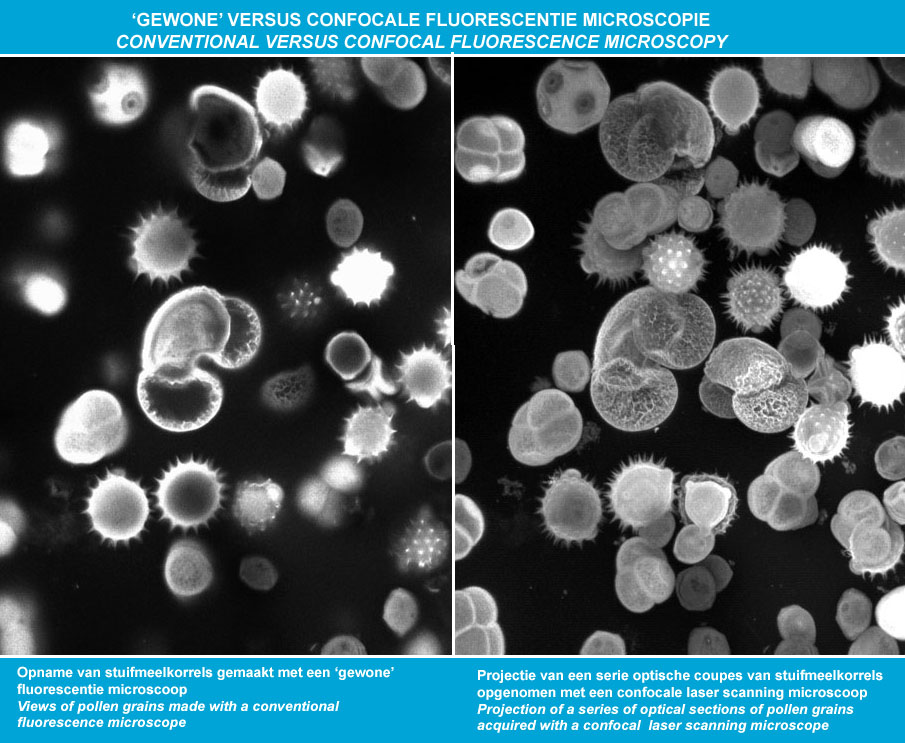
microscopy, which can be applied in reflection, transmission as well as fluorescence mode. With the CLSM technique sharper images of microscopical objects (here represented by blue spots) can be obtained than with a normal (wide-field) microscope (see the
difference; more about
microscopy in general at the website "optical Microscopy Primer", with links to
excitation and emission of fluorochromes and to the parts of a
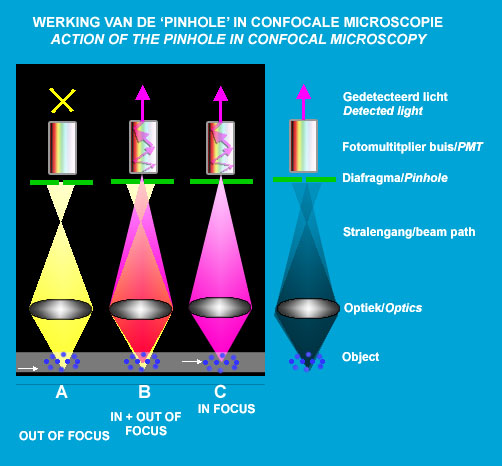
fluorescence microscope ...). This is possible because in confocal microscopes, in contrast to standard-microscopes, only the light beams originating from the layer in the object that is
exactly in-focus is allowed to pass to the detector (situation C). All other beams emaning from higher or lower levels (situation A), which normally also contribute to image formation, are blocked. This happens by means of a pinhole pinhole (green line with opening in the figure), which position concords with the focus distance of the object (therefore called
confocal; B shows a combination of A and C; only the purple light beams can pass the pinhole. More details and data on the
light paths in CLSM in the figure on the website of Olympus ...). The views of thin layers in the object, also called optical sections, are obtained without that the object is actually sectioned into slices.
The illumination source in CLSM is due to one or several
lasers (
Light
Amplification by the
Stimulated
Emission of
Radiation; More about
lasers ...). Lasers have the characteristics that they emit strong and monochromatic light that can be focused to a point-shaped light source, which is favorable for the resolution. In some system the laser beam is pivotted by means of rotating mirrors in order to perform a xy-
scan pattern over the object. Synchronously the reflection, transmission or fluorescence signal is collected point-by-point and reconstructed into a
xy image. In order to achieve the scan function some microscopes utilize a Nipkow disk instead of mirrors, while others bear a stage able to perform accurate and rapid translations (more about
scanning methods ...). CLSM offers possibilities to sensitively detect and enhance weak emission signals, which would be barely distinguished with a normal microscope, so that the final result is a bright and contrasted image displayed on a computer monitor (this is accomplished in particular thanks by the use of photomultipliers tubes =
PMTs and charge-coupled device = CCD cameras, in conjunction with digital image enhancement).
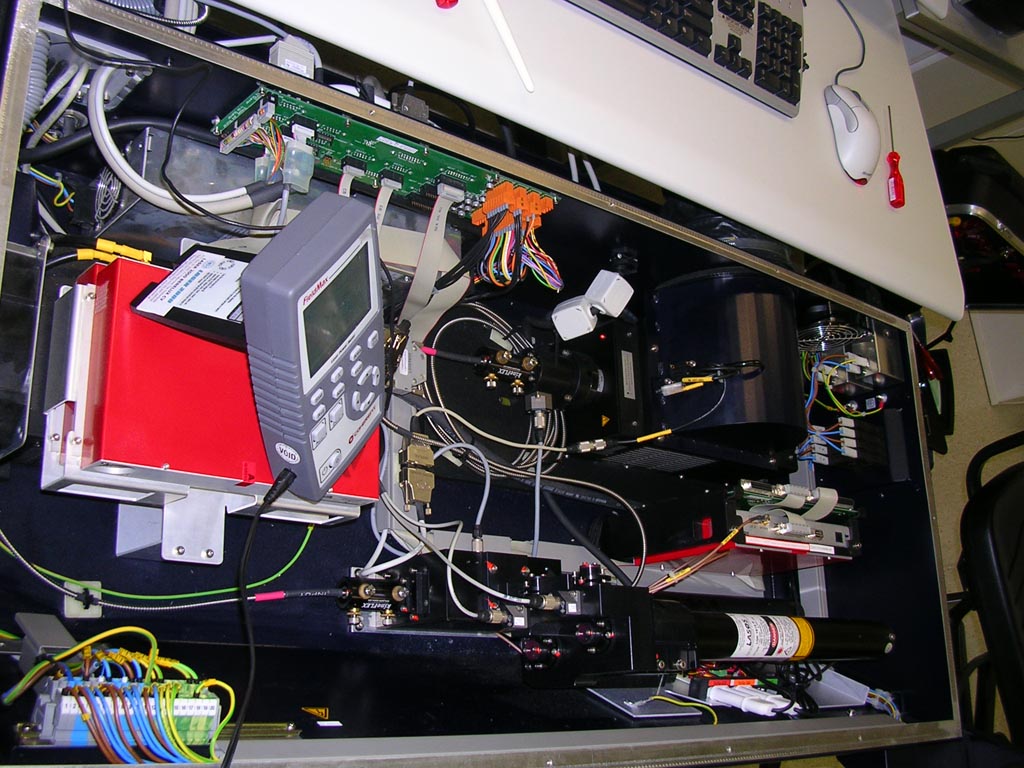
| Laser box |
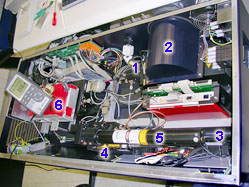 |
| Lasers and other devices in the container below the monitor table1 = Argon laser, 2 = ventilator for the AR laser, 3 = 633 nm HeNe laser, 4 = 561 nm laser, 5 = 594 nm laser, 6 = adjustment units |
More information on the
theory of CLSM,
'normal' CLSM,
Multiphoton confocal microscopy, and the difference between
single versa multiphoton CLSM-techniques (dr. Bruce Jenks, Science Faculty). Tip: get a life impression of a confocal microscope with the
CLSM simulator. For technical specifications on the confocal microscope shown here and information about the possibilities to employ this instrument, please, surf to the webpage of the department of
General Instruments.
Multi-dimensional CLSM: x-y-z-t-lambda-imaging
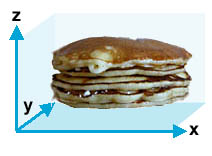
By gradually varying the distance between the object and the objective of the microscope with tiny steps (<< 1/100 mm per step), sharp
xy images can be recorded at all levels (
z dimension) within the object. In this way a z-pile of xy views, simlar to a pile of pancakes (see an animation of a
xyz-series consisting of 27 images collected though subsequent steps taken 6 micrometer apart in depth). These images can be reconstitued by means of projections to a whole. Furtheron on can acquire time-lapse views (
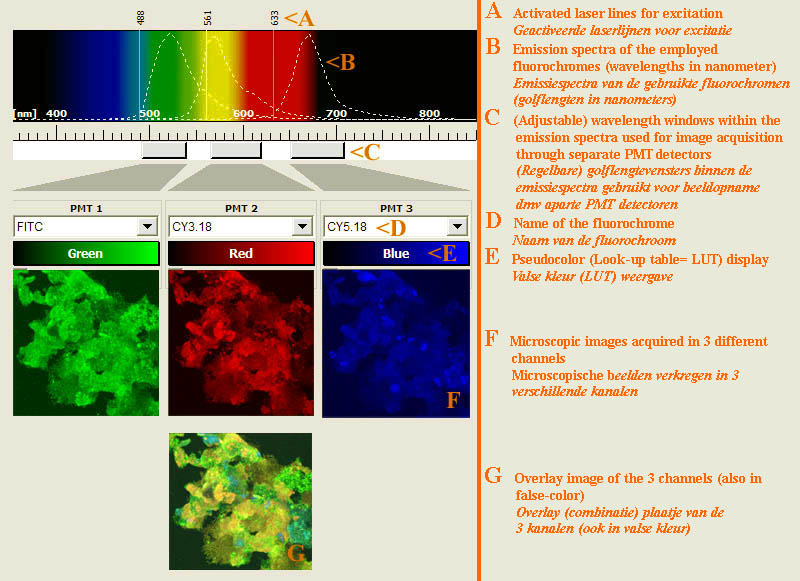
t dimension), so that movements and changes in structures overtime can be studied. Finally, the emission light of fluorescing substances can be collected though distinct channels on account of the differences in color (= wavelenght of light, abbreviated
lambda). Thus, in one and the same sample several specific labels, each with an own fluorescence spectrum, can be observed separately but simulatenously, which can be valuable in order to unravel the relationship between the various structures.
FRAP (Fluorescence Recovery After Photobleaching) is a method that is applied to analyze the mobility of molecules in a sample; firstly, the object is bleached with a high dose of laser light and then recovery of fluorescence is mapped, which is a function of the migration of undamaged fluorescing particles/molecules from the surrounding into the bleached area.
FRET (Fluorescence Resonance Energy Transfer) is another special technique, which provides information on the distance between two types of -fluorescing- molecules with specific FRET-properties, e.g. an activator and a receptor; excition light energy is absorbed by the first molecule and transfered ('under water') to the other molecule, provided the two molecules are in a certain radius from each other, so that the last one emits fluorescence.
| x-y-z-t and lambda views |
|
| 
|
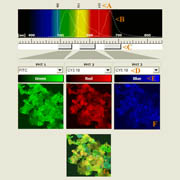
| xyz: the spatial dimensions | t: the time dimension | lambda: the wavelength/color dimension |
| Click on the image to play a series of 27 images taken each time at 6 micrometer z-distance.
| Click on the image to play a time-lapse movie of movements in living cells.
| Click on the thumbnail to get a zoom-in illustration providing explanations on multi-color fluorescence imaging. See xyz-lamba animation |
| These galopping horse of tiny size stick out in profile above the Brandenburger port on German 20 Eurocent coins. The colors in these views give an indication about the intensity of the reflected light. | These fibroblasts were labeled with two fluorochromes; the cell nuclei are shown in blue and the mitochondria in red (pseudocolor). |
In this example clumps of bacteria have been marked with three different fluorescering substances (FITC, CY3 and CY5), each having an own excitation and emission profile. |